Williams %R - Balance of Power Strategy
This indicator was developed by Larry Williams and it is a version of the Stochastic Oscillator. Its values are plotted on an inverted scale from 0 to -100. Williams %R is efficient in trending markets.
There are two interpretations of the signals:
* Values below -80 - -90 indicate an oversold market, while values above -10 - -20 show that the market is overbought (remember that the scale is inverted).
The other logic is opposite:
* When the value of %R is higher than -10 - -20 the market is in a strong uptrend and respectively when %R is lower than -80 - -90 there is a strong downtrend.
A Moving Average is used to confirm the trend direction.
In this example strategy we will exit the market when the Balance of Power indicator crosses the zero line in the position's direction. The position closing price will be Bar Closing.
We will use the following opening rules:
Rules for a long position
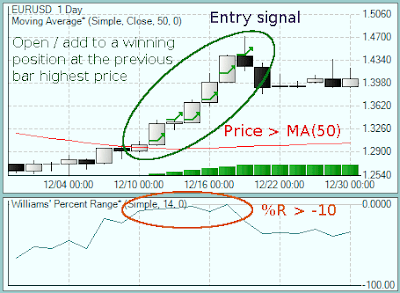
* Price is above the 50-period Moving Average (uptrend) and Williams %R goes above -10 (second signal for a strong uptrend0. The bar when this happens is marked as Signal bar.
* Long position is initiated when the price breaks above the high of the Signal bar.
* After opening a position we monitor Balance of Power indicator. When it crosses the zero line upward we close the position at the bar closing price.
* Adding: if the price is still higher than MA(50) and %R is above -10 line, we add to a long position at the previous bar high.
Rules for a short position
* Price is below the 50-period Moving Average (downtrend) and Williams %R goes below -90 line. The bar when this happens is marked as Signal bar.
* Short position is initiated when the price breaks below the low of the Signal bar.
* The exit is at the bar closing price, but only when BoP crosses the zero line downward.
* Adding: when the entry conditions are satisfied we sell at the previous low.
Indicator chart

--- by ; Svetlin Minev ------
Saturday, November 28, 2009
Forex Indicator ; Williams %R Strategy
Subscribe to:
Post Comments (Atom)


0 comments:
Post a Comment